|
Long Term Attendance and Achievement
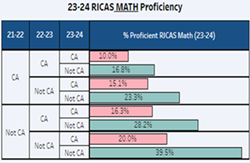
NEW! 10/18/2024 Long-term chronic absenteeism has a compounding, negative impact on student performance. But students can turn it around if they show up to school. In other words, a history of chronic absenteeism does not predict the academic future of our children.
|

|
Historical Absences
Updated 10/18/2024
This data story unpacks the recently released 2023-24 chronic absenteeism data. It provides snapshots going back to 2017 so that users can see the impact of the pandemic on student attendance. You can sort by various student groups and look at change over time in schools and districts.
|
|
Chronic Absenteeism and Achievement
Updated 10/18/2024
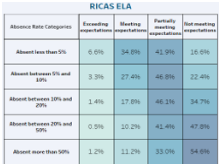
This dashboard details, by varying attendance levels, the impact of chronic absence on state assessments. Leaders can drill into student groups to identify specific populations affected.
|
|
Community Dashboard
Updated 10/18/2024
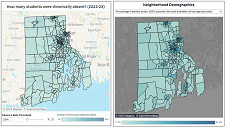
Users can drill into chronic absenteeism at the census tract and block group levels. Users can filter to see whether certain demographic characteristics, (i.e., home ownership, access to internet), correlate with chronic absenteeism. They can also examine the impact of chronic absenteeism on achievement.
|
|
Real-time Attendance Dashboards
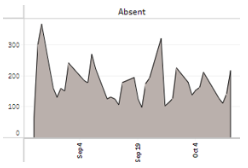
This set of dashboards lets you dig deep into real time data. The site refreshes daily. You can examine changes from this year to last, examine attendance by multiple subgroups, look at monthly attendance trends and track early dismissals and tardies.
|
|
Daily Chronic Absenteeism Update
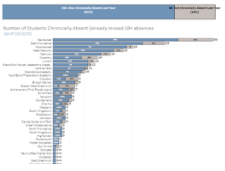
Were they chronically absent last year? On this real time dashboard, you can see, by district and grade span, the percent of students that are already chronically absent as well as the number of these students that were also chronically absent last year.
|


